 Calando
You step on the scale on Monday and see 184.2 lb. On Tuesday it says 185.0. You didn't do anything different. What happened?
Usually, nothing that matters. Day-to-day swings of a pound or so (around half a kilogram) are common, and they say more about the moment you weighed in than about where things are heading.
Why a single weigh-in can mislead
A scale measures everything at once. Some of what it picks up changes from one day to the next:
- Water. How much you drank, how warm it was, how much you sweated.
- Salt. A saltier meal can mean more water held the next morning.
- Food still being digested. A late or large dinner is still partly there in the morning.
- When and how you weighed in. Morning or evening, before or after eating, clothes on or off, which spot on the floor.
None of these is a change in body fat overnight. They are noise on top of the trend.
Weigh in the same way each time
You can't remove the noise, but you can stop adding to it:
- Same time of day; many people pick first thing in the morning, before eating.
- Same scale, on the same hard floor.
- Similar clothing, or none.
You don't have to weigh in every day. But the more readings you have, the steadier an average becomes.
What a 7-day average does
A 7-day average adds up the last seven days' readings and divides by seven. One high or low day moves it only a little. Here's a made-up week:
| Day | Mon | Tue | Wed | Thu | Fri | Sat | Sun |
|---|---|---|---|---|---|---|---|
| Weigh-in (lb) | 184.2 | 185.0 | 183.6 | 184.8 | 183.4 | 184.6 | 183.8 |
The readings span 1.6 lb, but the average for the week is 184.2 lb. Next week's average, compared with this one, says far more than Tuesday compared with Monday.
Reading the line
- Look at weeks, not days. The direction of the average over several weeks is the part worth reading.
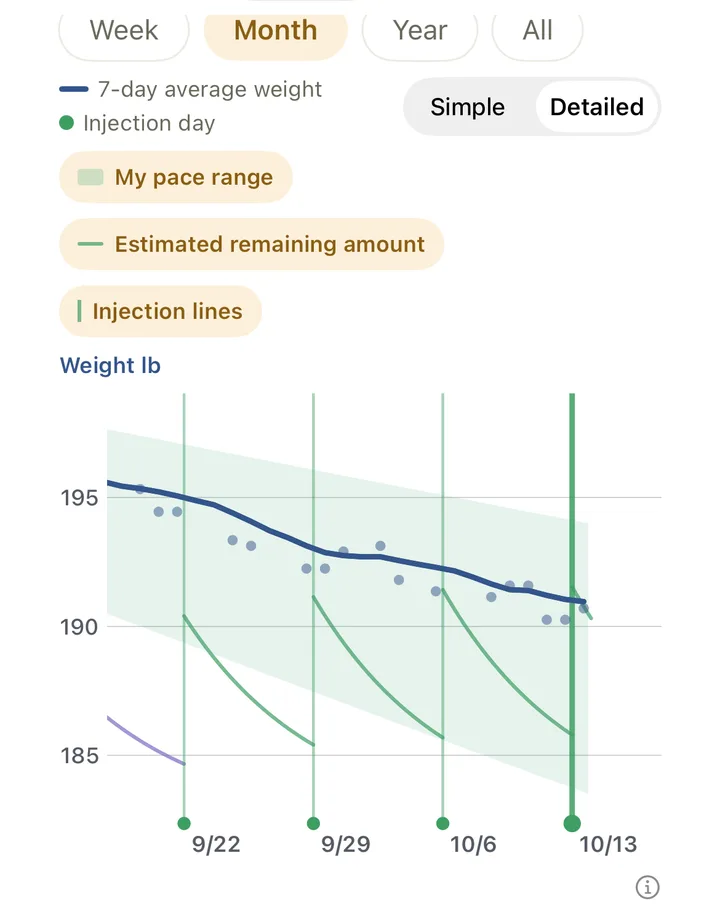
- Expect the daily dots to scatter. Dots above and below the line are normal; that's what the line is for.
- Note what else happened. Shot days, a pause, travel. Seeing them on the same timeline helps you look back. If you're on a weekly shot, an injection log puts those days next to your weight.
Comparing with a range you set
Some people like to compare their average with a pace they have in mind. In Calando that's a range you set yourself in Settings, drawn as a pale band behind the chart. It isn't a target the app gives you, and the app doesn't suggest one: what pace makes sense for you is a conversation with your clinician.
Calando draws the 7-day average for you and marks your injection days on the same chart; it also keeps going while a GLP-1 is paused.